Introduction
Input Data Format
Uploading and Processing
Obtaining an account
Upload Form
Data uploading
Processing Datasets
Project Management
Browsing Pathways
Promoter analysis
Analyzing Dataset
Changed Pathways
GO Enrichment
Functional classification
Searching
Adding New Platforms
Update Pathways and Genes
Contacts
|
Browsing Pathways
The "Browse" option on the menu bar allows users to observe or examine different
biochemical pathways based on the selected expression dataset and/or metabolite
dataset.
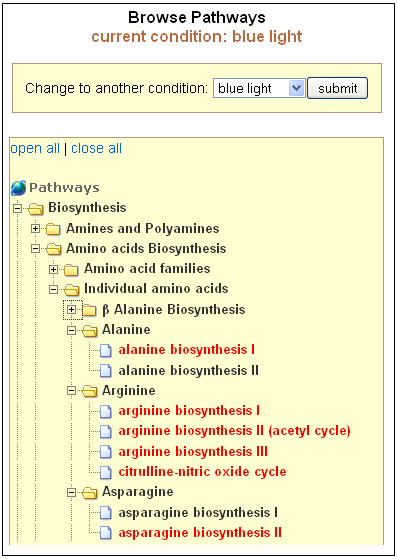
All Pathways
Selecting "All Pathways" shows all biochemical pathways for a particular condition
in a folder tree format organized by the type of pathways. Options to open and
close all folders are also provided. Pathways in black indicate no changes at all,
while those in red indicate a change in gene expression/metabolite content.
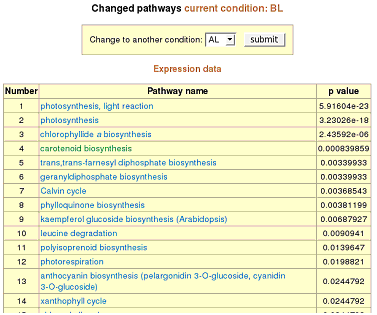
Changed Pathways
Selecting "Changed Pathways" shows only the pathways that have any overall changes
in gene expression and/or metabolite content, as well as the corresponding p values
for each pathway indicating how significant the pathway changes.
Pathway details
In both "Browse All Pathways" and "Browse Changed Pathways" described above, each
pathway is linked to its detail page. A pathway detail page includes a graphical
visualization of the biochemical pathway with each molecule/metabolite highlighted
with different colors to indicate the changes of gene expression or metabolite levels.
Links to the list of all genes and metabolites in the pathway, as well as the link
to the pathway in the original BioCyc database, are also provided in this page. Genes
and metabolites in the pathway image are linked to pages containing their detail
information.
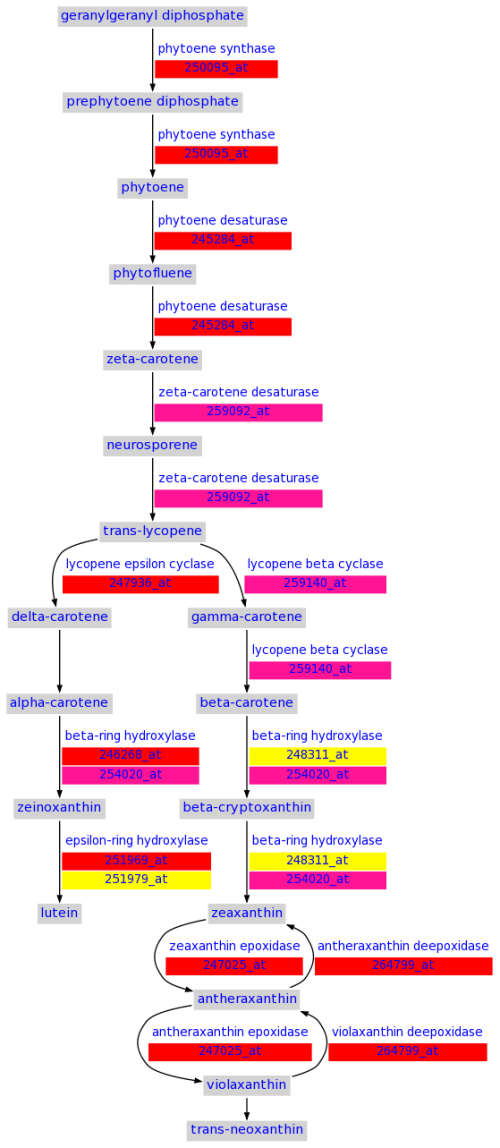
Color legend
Plant MetGenMAP uses the following color legend to indicate differences of gene
expression/metabolite level changes:
- Uploaded dataset contains p values.
| | the ratio is greater than the up-regulation
cutoff and the p value is significant |
| | the ratio is less than the down-regulation
cutoff and the p value is significant |
| | the ratio does not meet either the up-regulation
or down-regulation cutoff while the p value is significant |
| | the ratio is greater than the up-regulation
cutoff while the p value is not significant |
| | the ratio is less than the down-regulation
cutoff while the p value is not significant |
| | the ratio does not meet either the up-regulation
or down-regulation cutoff and the p value is also not significant |
| | not measured or filtered out |
- Uploaded dataset does not contain p values.
| | the ratio is greater than the up-regulation cutoff |
| | the ratio is less than the down-regulation cutoff |
| | the ratio does not meet either the up-regulation or down-regulation cutoff |
| | not measured or filtered out |
|