Introduction
Input Data Format
Uploading and Processing
Obtaining an account
Upload Form
Data uploading
Processing Datasets
Project Management
Browsing Pathways
Promoter analysis
Analyzing Dataset
Changed Pathways
GO Enrichment
Functional classification
Searching
Adding New Platforms
Update Pathways and Genes
Contacts
|
Obtaining an account
In order to upload and analyze a dataset, you MUST have an account in the system.
To obtain a new account, fill out the registration form accordingly. A confirmation email
will then immediately be sent to the email address provided. To complete the registration
process, the user must activate the account by clicking on the link provided in the
confirmation email. Once the account is activated, the user can login to upload your
dataset.
Accessing the Upload Form
- For existing users who have datasets stored in the system:
While signed into a user account, mouse over the "Data Manage" tab in the menu bar to access
the drop down menu. Click on the "Upload data" option.
- For new users and users with no datasets loaded in the system:
Upon signing into a user account, there will be a prompt asking the user to upload a dataset.
Or the user can use the same process as described above to access the upload form.
Data uploading
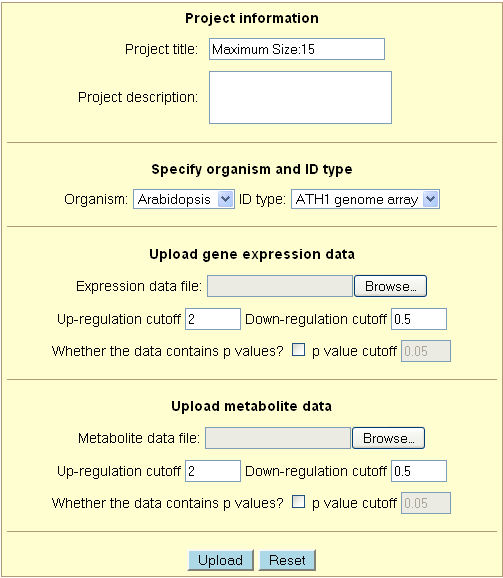
Each field of the upload form is explained below in detail:
1. Project information
- Project title - Title of the project. Cannot exceed 15 characters.
- Project description - Description of the project. There is no limit to the number of
characters in the description.
2. Specify organism and ID type
- Organism - Choose the organism from which the dataset was generated.
The options currently include Arabidopsis, rice and tomato.
- ID type - Choose the identification format used in the gene expression dataset.
The options for this parameter are dependent on which organism is chosen. Options for
Arabidopsis include: ATH1 genome array and TAIR locus number (e.g., AT1G01040). Options
for rice include: Affymetrix genome array and the genome locus number (e.g., LOC_Os10g33000).
Options for tomato include: TOM1 cDNA array (e.g., 1-1-7.4.19.9), TOM2 oligo array (e.g.,
LE3D02), Affymetrix genome array and SGN unigene (version: Tomato_200607_build_1; e.g.,
SGN-U314663).
Note to tomato TOM2 oligo array users: Due to the multiple
printing formats of TOM2 arrays, the system has stopped supporting the previous probe ID
system for TOM2 arrays and started to use the original Plate IDs. Please contact us if
there are any questions.
3. Upload gene expression data
- Expression data file - Enter the path and file name of the expression
data file to be uploaded. The file must be in the correct format as indicated
above.
- Up-regulation cutoff - Sets minimum value that characterizes a gene as significantly
up-regulated. Default value is 2.
- Down-regulation cutoff - Sets maximum value that characterizes a gene as significantly
down-regulated. Default value is 0.5. If the values in the dataset are fold changes or log2
transformed ratios, a negative value is needed as a cutoff.
- Whether the data contains p values - Indicates whether or not the dataset contains
p values. For datasets without p values, leave the check box blank.
- p value cutoff - Sets value as maximum for significance. Default value is 0.05.
4. Upload metabolite data
- This part is largely identical to the above section - "Upload gene expression data".
The user can upload both expression and metabolite profile data generated under one project
at the same time. Just leave the other "path and file name" field blank if only one file is
uploaded.
During the uploading process, the system checks whether the gene/metabolite identifiers are
consistent with the ones stored in the database. For metabolites, the system accepts all
synonyms listed in the metabolite
synonym file. Warnings could be generated during the uploading process if the identifiers
were not found in the database. For metabolites, this could be due to that these metabolites
are not in the pathways. You can ignore these warnings and the system will not include the
unmatched genes/metabolites in the downstream analyses.
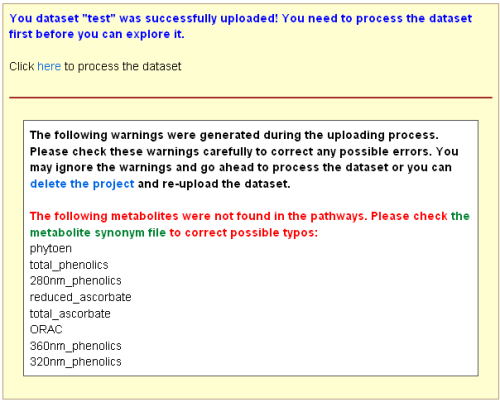
Note: Please check your file carefully to make sure no typo
errors in gene/metabolite identifiers.
Processing Datasets
The uploaded datasets CANNOT be analyzed or explored until they are processed.
Immediately after the dataset is uploaded, the system will ask the user to process the
dataset. Processing can also be done at a later time at the "Project Management" page
which lists the uploaded datasets in the system under the current user (for more
information, see the "Project management" section). Datasets not yet processed have
an option to be processed under its list of actions.
The data processing step will assign a code to each gene under each condition to indicate
whether the expression of this gene is increased, decreased, or unchanged. The step will
also identify changed pathways under each condition and calculate the significance of the
change.
Significance of changed pathways
The significance of a changed pathway is determined using the hypergeometric distribution:
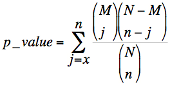
Where N is the total number of genes/metabolites in all the pathways, M is the total number
of genes/metabolites in a particular pathway, n is the total number of significantly changed
genes/metabolites in all the pathways, and x is the total number of significantly changed
genes/metabolites in that particular pathway.
The p value obtained above can be explained in the following way:
Suppose that we have a total of N genes in all the pathways, and M genes belong to a particular
pathway. Then the p value represents the possibility that, in a sample of n changed genes of
all the pathways, we observe x or more changed genes in that particular pathway.
|